FunnelCockpit Dashboard — A Guided Tour
Getting Oriented
The FunnelCockpit dashboard is your real-time command center. It pulls together key performance indicators (KPIs) and quick-access tools so you can see what matters first: revenue, visitor traffic and lead growth.
Fixed KPI Cards
- Revenue (Umsatz) – Total sales in your selected period.
- Visitors – All unique visits across your funnels.
- Contacts – Net new leads captured.
- FunnelCockpit Award promo – A shortcut to the program where high-performing funnels are showcased.
Flexible KPI Cards
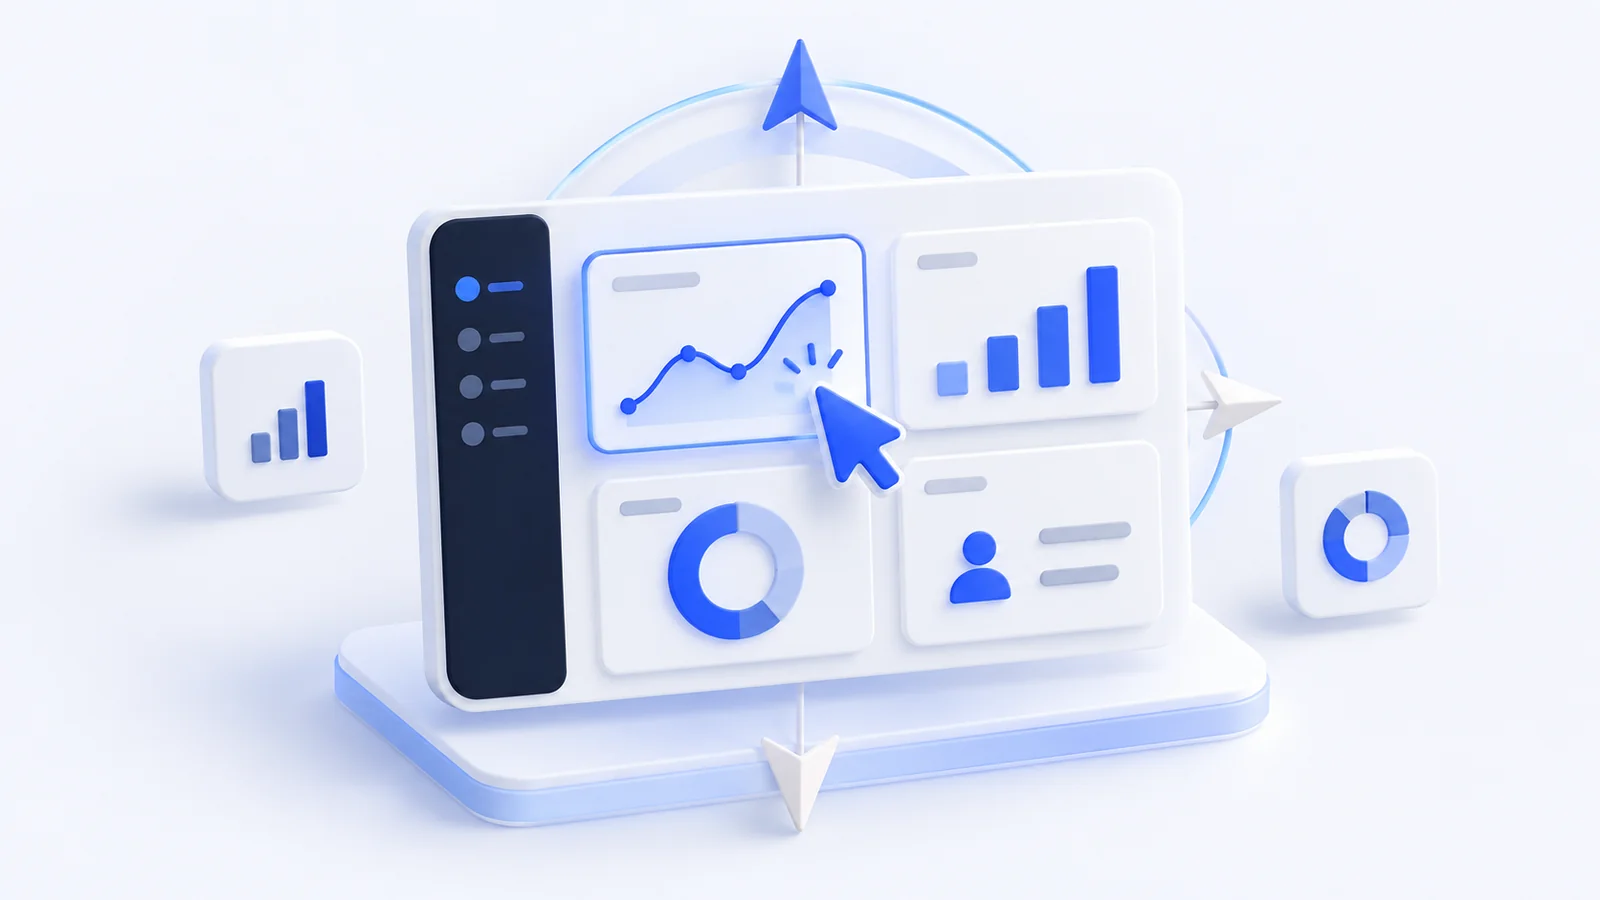
Below the fixed cards you will find fully configurable “flex” cards. Drag them, resize them or remove them to design a workspace that fits your daily routine.
- Visitors & Split-Tests – Shows traffic per funnel and highlights ongoing split tests.
- Device Distribution – A pie chart and percentages for mobile vs. desktop visitors.
- Revenue & Profit – Sales totals plus calculated profit if you have connected payment providers.
- Contact Growth – Daily opt-ins and opt-outs plotted side-by-side.
- Recently Edited Funnels – Your five most recent funnels with a quick link to All Funnels.
Resizing a Card
- Click the gear icon on any flex card.
- Choose a width:
- 33 % – one-third column
- 66 % – two-thirds column
- 100 % – full-width banner
- Watch the live preview behind the modal; other cards shift automatically.
You can also reposition cards instantly:
- Arrow Left / Right – Move the card horizontally.
- Arrow Up / Down – Bump the card to the next row.
Filtering Metrics by Funnel
Need laser-focused data? Open Settings → Select Funnel inside any card and pick a single funnel. All graphs and counters in that card switch to funnel-specific mode.
Adding New Dashboard Elements
Hit the “+” icon at the bottom of the dashboard to insert additional cards.
- Ad Spend appears once you connect a Facebook Ads or Google Ads account under Integrations → Ad Accounts.
Cleaning Up
If a metric is no longer relevant, click the trash-can icon to remove the card. You can restore it any time via “+ Add Element.”
Best Practices
- Review the dashboard daily to spot unusual traffic or revenue swings early.
- Keep only the KPIs you act on; less clutter means faster insights.
- Re-order cards at the start of a campaign so your primary goal (e.g., leads or purchases) is top-left.